MTK 平台 ANR 分析
KeyDispatchTimeout(谷歌默认 5s,MTK 平台上是 8s)
Trace 文件
Trace 文件是 android davik 虚拟机在收到异常终止信号 (SIGQUIT)时产生的。
1 | // ActivityManagerService.java |
Android 低版本的 ANR 文件路径可以通过 adb 命令获取:adb shell getprop dalvik.vm.stack-trace-file,如:/data/anr/traces.txt
也可以通过 adb shell setprop dalvik.vm.stack-trace-file 设置 ANR 文件保存路径。
需要在开发者模式中打开“显示所有应用无响应(ANR)。
发生 ANR 时 log 会保存在 /data/anr/ 目录下,使用 adb pull 命令导出查看。
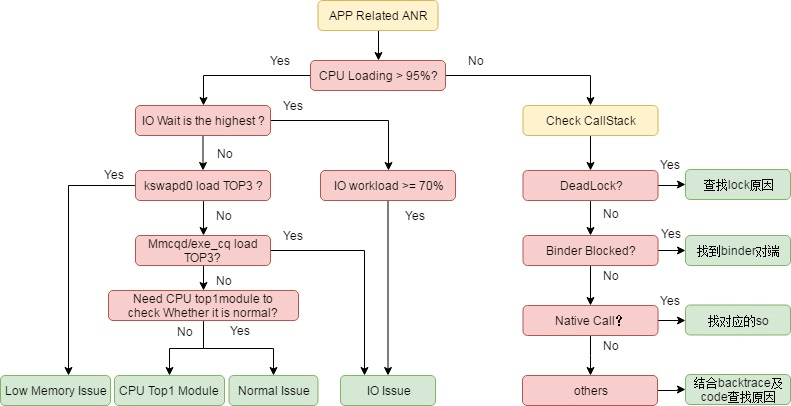
产生 ANR 的原因:
CPU 密集,导致主线程分配不到 cpu 时间片,要注意 cpu 占用高的进程;高IO,应用在主线程上非常缓慢地执行涉及 I/O 的操作,如复杂的 layout、频繁的 I/O 操作。(log 中 cpu 的使用 iowait 占比高);低内存(low memory),系统或者应用自身可用内存紧张,系统一直在执行 lowmemorykiller 操作查杀进程;- 主线程存在耗时操作:主线程阻塞(Blocked)、挂起(suspend)、死锁、死循环、耗时操作等。通常 log 中会有以下字段 Blocked | locked | waiting to lock | held by thread,这个时候 cpu 多数是空闲,使用占比很低;
Binder 通信等待超时,当前应用进程进行进程间通信请求其他进程,其他进程的操作长时间没有反馈,例如操作硬件 Camera;- Service
binder 数量达到上限; - 在 system_server 中触发 WatchDog ANR;
- 应用频繁 crash:包括应用自身也容易导致前台应用出现 anr 的现象;
Anr Trace
文件路径在 /data/anr/anr_2019-06-08-09-54-45-557。
1 | ----- pid 3387 at 2019-06-08 09:54:45 ----- |
main:main 标识是主线程,如果是线程,那么命名成“Thread-X”的格式,x 表示线程 id,逐步递增
daemon: 如果有说明这是个守护线程
prio:线程优先级,默认是 5
tid:tid 不是线程的 id,是线程在该进程中唯一标识 ID
进程 pid: getpid()
线程 tid: pthread_self() //进程内唯一,但是在不同进程则不唯一。
线程 pid: syscall(SYS_gettid) //系统内是唯一的
Sleeping:线程当前状态(TIMED_WAIT 或 SUSPENDED 在 anr 时很常见)
group: 线程组名称
sCount:suspendCount,该线程被挂起的次数
dsCount:debugSuspendCount,线程被调试器挂起的次数
obj:线程的 Java 对象地址
self:该线程 Native 的地址
sysTid:是线程号(主线程的线程号和进程号相同)
nice:是线程的调度优先级
cgrp:调度归属组
sched:分别标志了线程的调度策略和优先级
handle:线程处理函数的地址
state:是调度状态
schedstat:从 /proc/[pid]/task/[tid]/schedstat 读出,三个值分别表示线程在 cpu 上执行的时间、线程的等待时间和线程执行的时间片长度,不支持这项信息的三个值都是 0
utm:是线程用户态下使用的时间值(单位是 jiffies)
stm:是内核态下的调度时间值
core:是最后执行这个线程的 cpu 核的序号。
线程的分类:
- “Signal Catcher” 负责接收和处理 kernel 发送的各种信号,例如
SIGNAL_QUIT、SIGNAL_USR1 等就是被该线程接收到,这个文件的内容就是由该线程负责输出的,可以看到它的状态是 RUNNABLE。 - Binder 线程是进程的线程池中用来处理 binder 请求的线程;
- JDWP 线程是支持虚拟机调试的线程,不需要关心;
线程的状态:
1 | ThreadState (defined at “dalvik/vm/thread.h “) |
ANR 发生前之后 CPU 的使用率
tag 定义如下:
2721 cpu (total|1|6),(user|1|6),(system|1|6),(iowait|1|6),(irq|1|6),(softirq|1|6)
CPU 使用率可以理解为一段时间(记作 T)内除 CPU 空闲时间(记作 I)之外的时间与这段时间 T 的比值,用公式表示可以写为:CPU 使用率 = (T – I) / T,而时间段 T 是两个采样时间点的时间差值。之所以可以这样计算,是因为 Linux 内核会把从系统启动开始到当前时刻 CPU 活动的所有时间信息都记录下来,我们可以通过查看/proc/stat文件获取这些信息。
主要包括以下几种时间,这些时间都是从系统启动开始计算的,单位都是 0.01 秒:
user: CPU 在用户态的运行时间,不包括 nice 值为负数的进程运行的时间
nice: CPU 在用户态并且 nice 值为负数的进程运行的时间
system:CPU 在内核态运行的时间
idle: CPU 空闲时间,不包括 iowait 时间
iowait: CPU 等待 I/O 操作的时间
irq: CPU 硬中断的时间
softirq:CPU 软中断的时间
- 如果 CPU 使用量和高,说明当前线程很忙(内存不足,循环处理等)
- 如果 CPU 使用量很少,说明主线程被 BLOCK 了。
- 如果 IOwait 很高,说明 ANR 有可能是主线程在进行 I/O 操作造成的。
reason 类型
ANR reason 主要有以下几类:
- 有应用,无窗口:Waiting because no window has focus but there is a focused application that may eventually add a window when it finishes starting up。
- 窗口暂停: Waiting because the [targetType] window is paused.
- 窗口未连接: Waiting because the [targetType] window’s input channel is not registered with the input dispatcher. The window may be in the process of being removed.
- 窗口连接已死亡:Waiting because the [targetType] window’s input connection is [Connection.Status]. The window may be in the process of being removed.
- 窗口连接已满:Waiting because the [targetType] window’s input channel is full. Outbound queue length: [outboundQueue 长度]. Wait queue length: [waitQueue 长度].
- 按键事件,输出队列或事件等待队列不为空:Waiting to send key event because the [targetType] window has not finished processing all of the input events that were previously delivered to it. Outbound queue length: [outboundQueue 长度]. Wait queue length: [waitQueue 长度].
- 非按键事件,事件等待队列不为空且头事件分发超时 5000ms:Waiting to send non-key event because the [targetType] window has not finished processing certain input events that were delivered to it over 500ms ago. Wait queue length: [waitQueue 长度]. Wait queue head age: [等待时长].
targetType: 取值为”focused”或者”touched”
Connection.Status: 取值为”NORMAL”,”BROKEN”,”ZOMBIE”
MTK Log
关键字:anr、am_anr、Application is not responding、ANR in
__exp_main.txt:异常类型,调用栈等关键信息。
SYS_ANDROID_LOG: main log,上层 app 以及 framework 相关活动的 log
SYS_ANDROID_EVENT_LOG: 系统事件 log,如 ActivityManager、powerManager 相关的活动记录
SYS_KERNEL_LOG:kernel log
SYS_VERSION_INFO:kernel 版本,用于和 vmlinux 对比,只有匹配的 vmlinux 才能用于分析这个异常。
DUMPSYS_ACTIVITY:AMS 日志
DUMPSYS_DBINFO :数据库操作记录
DUMPSYS_WINDOW :窗口记录,记录 anr 发生的窗口页面
PROCESS_STATE: 发生 ANR 程序的进程信息,虚拟机信息
SWT_JBT_TRACES:不知道怎么描述,自认为堆栈调用相关的记录吧
SYS_ANDROID_RADIO_LOG: 联网相关
SYS_BINDER_INFO:
SYS_BINDER_MEM_USED:
parser //parser 解析文件夹,基本解析了 anr 相关的信息,CPU、内存的诊断,binder 分析
adb 获取 main log: adb logcat -b main -v time > main.log
adb 获取 event log: adb logcat -b events -v time > events.log
1 | 01-02 12:45:58.325 1437 1495 I Process : Sending signal. PID: 16867 SIG: 3 |
1 | 01-07 10:37:43.453 I/InputDispatcher( 1187): Application is not responding: AppWindowToken{4feea63 token=Token{1be0092 ActivityRecord{c75e61d u0 com.android.server.emptyproject/.MainActivity t172}}}. It has been 5010.6ms since event, 5005.7ms since wait started. Reason: Waiting because no window has focus but there is a focused application that may eventually add a window when it finishes starting up. |
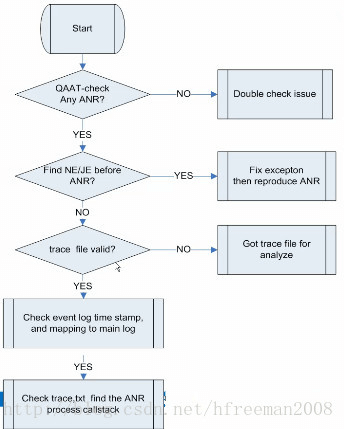
ANR 分析步骤
1. 确认时间点:
mobilelog 文件夹下的 events_log,搜索关键字”am_anr”,这一步用于确认 ANR 时间点,可以搜索到类似如下信息:
1 | 01-05 15:19:46.214 I/am_anr ( 506): [0,3975,com.android.server.emptyproject,818462534,Input dispatching timed out (8b8b1d3 com.android.server.emptyproject/com.android.server.emptyproject.MainActivity (server) is not responding. Waited 5005ms for KeyEvent(deviceId=-1, source=0x00000101, displayId=0, action=DOWN, flags=0x00000048, keyCode=4, scanCode=0, metaState=0x00000000, repeatCount=0), policyFlags=0x6b000002)] |
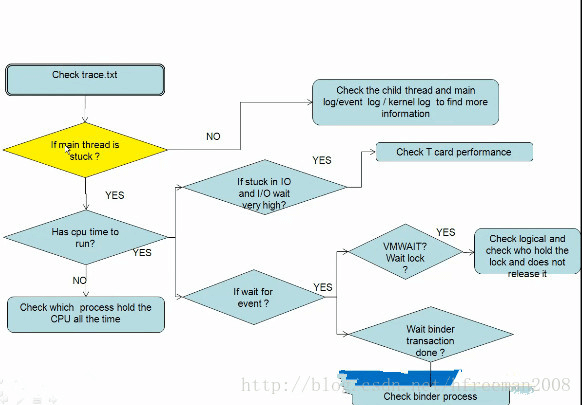
2. 查看 ANR 时的 CPU 以及 IO 率:
如果是 CPU 使用率高,可能是进程分配不了时间片导致的;如果是 IO 使用路高,可能是文件操作或数据库操作导致的。
这一步一般来说能基本定位是什么造成了 ANR,是 IO 高还是 CPU 高,如两者都不是,需进入第三步 trace 日志分析环节 查看 mobilelog 文件夹下的 main_log,搜索关键字”ANR in”,可以看到当时的 CPU 以及 IO 率。
这一个环节一般来讲主要是看发生 ANR 时的 CPU 使用情况,CPU 是否吃紧,
还有需要注意 iowait 的占有率,如果占比比较高,则排查的方向要倾向与读取文件操作有关的信息,可以看 trace 日志中有没有一些读取文件或者操作 SD 卡的动作
3. 分析 ANR 时的堆栈:
查看 mobilelog 文件夹下的 main_log,搜索关键字”ANR in”,再结合 event log 里 ANR 发生的时间点,分析发生 ANR 时的上下文。
常见场景分析
主线程死锁
卡在 IO 操作
ANRManager: 100% TOTAL: 2% user + 2.1% kernel + 95% iowait + 0.1% softirq
主线程有耗时的动作
这种情况是 ANR 类型问题里遇到最多的,比如读写文件,访问数据库和保存到 SP(同步),都可能造成主线程堵塞。一般来讲看当时的 CPU 使用情况会发现 user 占比较高。
主线程 Binder 调用等待超时
Binder 线程池被占满
系统对每个 process 最多分配 15 个 binder 线程,这个是谷歌的设计(/frameworks/native/libs/binder/ProcessState.cpp)。
如果另一个 process 发送太多重复 binder 请求,那么就会导致接收端 binder 线程被占满,从而处理不了其它的 binder 请求。这时候请求端发起的请求就会阻塞等待了(未设置异步请求的前提下),这本身就是系统的一个限制,如果应用未按照系统的要求来实现对应逻辑,那么就会造成问题。
判断 Binder 是否用完,可以在 trace 中搜索关键字”binder_f”,如果搜索到则表示已经用完,然后就要找 log 其他地方看是谁一直在消耗 binder 或者是有死锁发生。
JE 或者 NE 导致 ANR
因为 JE/NE 发生时会去 dump 一大堆异常信息,本身也会加重 CPU loading,修改完异常后再来看 ANR 是否还存在,如果还存在,那么就看 trace 堆栈,如果不存在,则可以基本判定是 JE 或 NE 导致。
只存在于 Monkey 测试下
有些问题是只有在 Monkey 环境下才能跑出来,平时的 user 版本用户使用是不会出现的,这种问题的话就没有改动的意义。
比如下面这个例子:
ActivityManager: Not finishing activity because controller resumed
03-18 07:25:50.901 810 870 I am_anr : [0,25443,android.process.media,1086897733,Input dispatching timed out (Waiting because no window has focus but there is a focused application that may eventually add a window when it finishes starting up.)]
发生这个 ANR 的原因是 Contoller 将 resume 的操作给拦截了, 导致 Focus 不过去, 从而导致 ANR,User 版本不会有 Contoller, 所以不会出现这个 ANR. 所以这个 ANR 可以忽略。