Android 分析内存泄露
内存泄漏是造成应用程序 OOM 的主要原因之一。Android 系统为每个应用程序分配的内存是有限的,而当一个应用中产生的内存泄漏比较多时,就会导致应用所需要的内存超过系统分配的内存阈值,这就造成了内存溢出从而导致应用 Crash。
抓取 hprof 文件
- 使用 am 命令
adb shell am dumpheap {pid} /data/local/tmp/sample.hprof; - 使用 Android Device Monitor 的 DDMS UI 工具;
- 使用 Debug Api,
Debug.dumpHprofData("/data/local/tmp/sample.hprof"); - 使用 AS 中的 Profiler Memory 功能;
在导出 hprof 文件前,先手动出发一次 GC,这样可以确保只保存那些无法回收的对象内存快照。
Eclipse MemoryAnalyzer 工具
1.12.0 版本要求 jdk11,修改 MemoryAnalyzer.ini 文件,在首行(不能添加到末尾)添加如下代码:
1 | -vm |
抓取 hprof 后,需要用 hprof-conv 命令将 DVM 格式的 hprof 文件转换成标准的 java 命令的 hprof 文件。hprof 工具在 android-sdk/platform-tools 文件夹下,命令格式为 hprof-conv before.hprof after hprof。
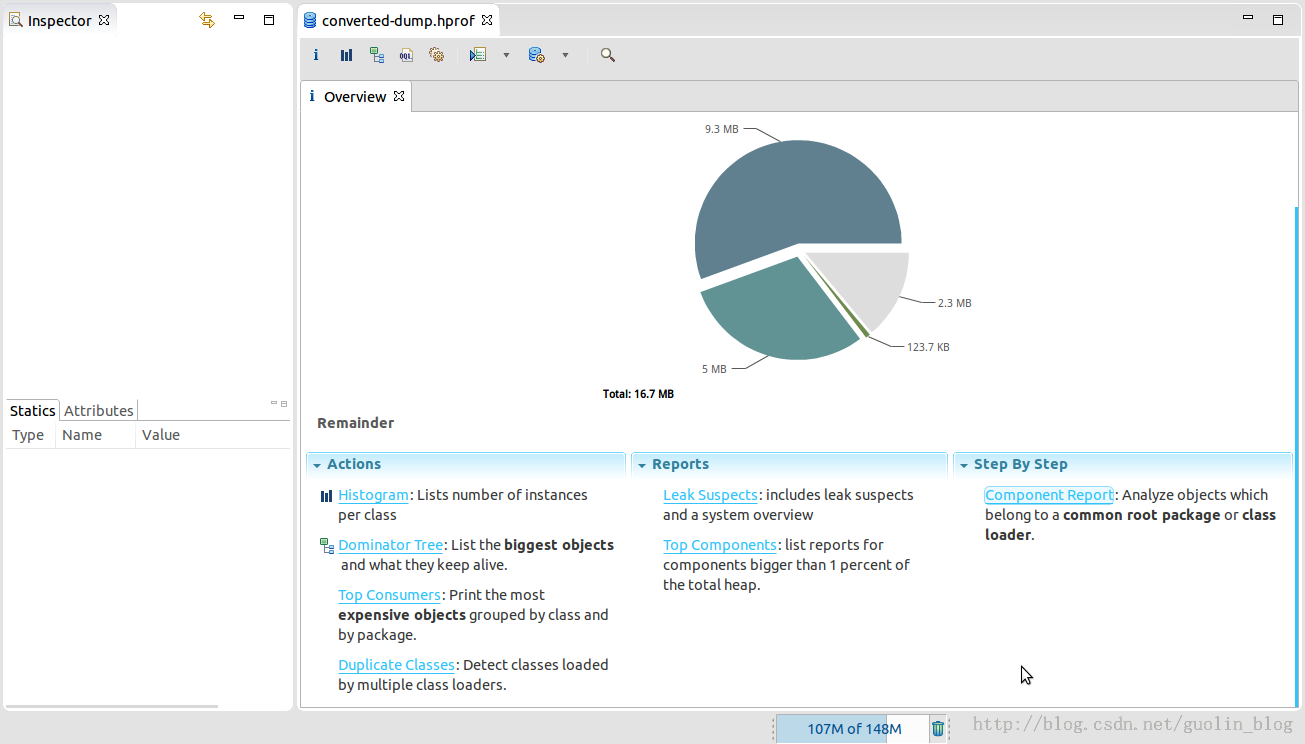
- Histogram:可以列出内存中每个对象的名字、数量以及大小。
- Dominator Tree:会将所有内存中的对象按大小进行排序,并且我们可以分析对象之间的引用结构。
A heap dump does not contain allocation information so it cannot resolve questions like who had created the objects and where they have been created.
Shallow Heap 和 Retained Heap 的区别:
Shallow Heap
当前对象自己所占内存的大小,不包含引用对象的内存。
Shallow heap is the memory consumed by one object. An object needs 32 or 64 bits (depending on the OS architecture) per reference, 4 bytes per Integer, 8 bytes per Long, etc. Depending on the heap dump format the size may be adjusted (e.g. aligned to 8, etc…) to model better the real consumption of the VM.
Shallow size of an object is the amount of allocated memory to store the object itself, not taking into account the referenced objects.
Dead objects are shown only with shallow size, as they do not actually retain any other objects.Retained Heap
当前对象自己所占内存的大小和引用对象的内存大小。
Retained size of an object is its shallow size plus the shallow sizes of the objects that are accessible, directly or indirectly, only from this object. In other words, the retained size represents the amount of memory that will be freed by the garbage collector when this object is collected.
Histogram
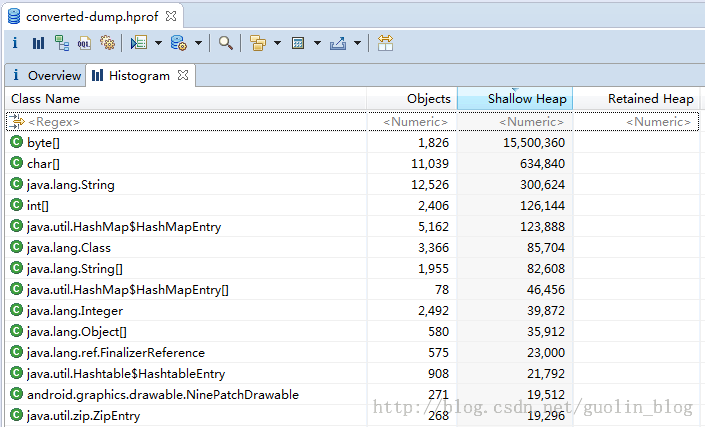
Histogram 可以显示对象的数量,通过对象的数量进行分析。
过滤 MainActivity:
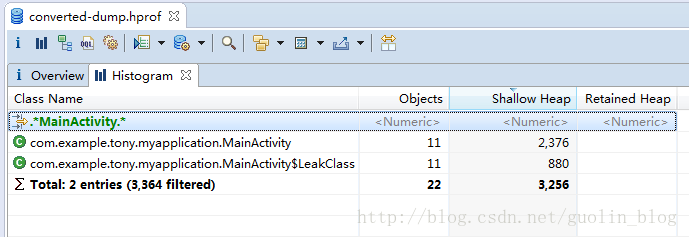
接下来对着 MainActivity 右键 -> List objects -> with incoming references 查看具体 MainActivity 实例,如下图所示:
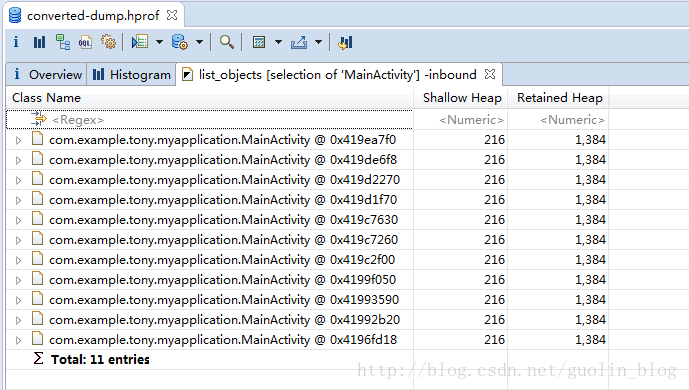
- with outgoing references:它引用了哪些对象。
- with incoming references:哪些对象引用了它。
如果想要查看内存泄漏的具体原因,可以对着任意一个 MainActivity 的实例右键 -> Path to GC Roots -> exclude weak references,结果如下图所示:
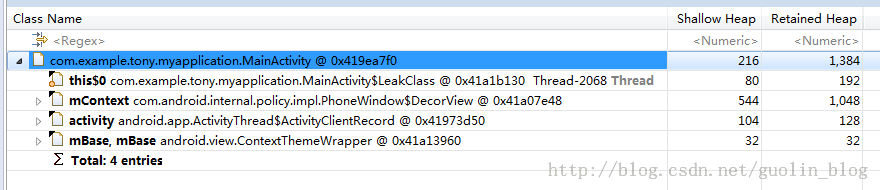
可以看到,内存泄漏的原因是因为 MainActivity$LeakClass 对象所导致的。
Histogram 基于类的角度,dominator tree 是基于实例的角度。
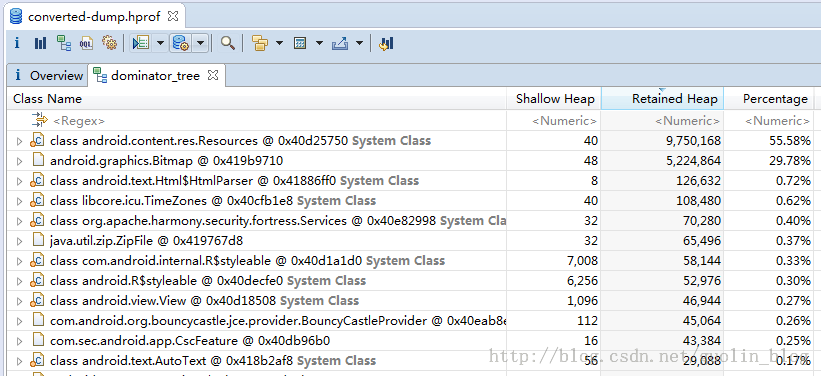
Dominator Tree
The dominator tree is a data structure that allows you to answer the question about the biggest objects in almost no time.
Dominator(支配者): 如果从 GC Root 到达对象 A 的路径上必须经过对象 B,那么 B 就是 A 的支配者。
在每一行的最左边都有一个文件型的图标,这些图标有的左下角带有一个红色的点,有的则没有。带有红点的对象就表示是可以被GC Roots访问到的。并不是所有带红色的对象都是泄漏的对象,因为有些对象系统需要一直使用,本来就不应该被回收。带红点的对象最右边都有写一个 System Class,说明这是一个由系统管理的对象,并不是由我们自己创建并导致内存泄漏的对象。
上图中,除了带有 System Class 的行之外,最大的就是第二行的 Bitmap 对象了,虽然 Bitmap 对象现在不能被 GC Roots 访问到,但不代表着 Bitmap 所持有的其它引用也不会被 GC Roots 访问到。
现在我们可以对着第二行点击右键 -> Path to GC Roots -> exclude weak references,如下图所示: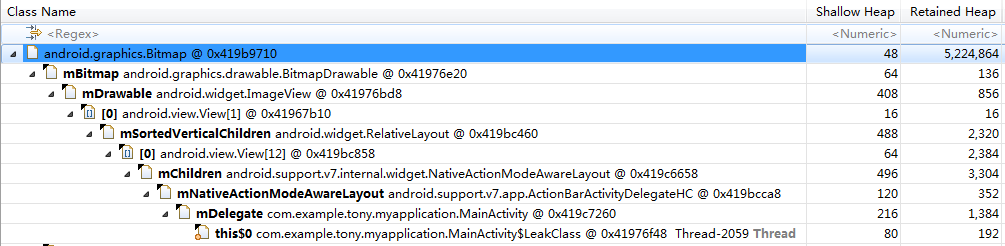
可以看到,Bitmap 对象经过层层引用之后,到了 LeakClass 这个对象,然后在图标的左下角有个红色的图标,就说明在这里可以被 GC Roots 访问到了,并且这是由我们自己创建的 Thread,并不是 System Class,导致它所持有的其它引用也无法被回收,包括 MainActivity 及 MainActivity 中所包含的图片。
OQL
1 | -- 查找所有的 MainActivity |
内存快照对比
- 方式一: 选中 “Histogram” 标签页。点击工具类中的 “Compare to another Heap Dump”。
- 方式二: Window > Navigation History,右击 histogram > Add to Compare Basket(如果不可点击,需要先右击 histogram > Activate),把需要比较的文件添加到 Compare Basket 标签页,方便比较。再点击 “Compare Basket” 标签底部右侧的 “Compare the results” 查看结果。
分析步骤
- 确定目标。Activity,Bitmap 还是其他对象。按包名分组,OQL 查找实例;
- 使用 “Paths to GC Roots” 查找引用链;
- 分析对象没有被回收的原因并修复;
Android Studio Memory Profiler
AS 不需要转换 hprof 文件,拖入 AS 自动转换。
Android Studio 中 Memory Profiler 顶部的内存计数图例:
- Java:从 Java 或 Kotlin 代码分配的对象的内存。
- Native:从 C 或 C++ 代码分配的对象的内存。
即使您的应用中不使用 C++,您也可能会看到此处使用的一些原生内存,因为 Android 框架使用原生内存代表您处理各种任务,如处理图像资源和其他图形时,即使您编写的代码采用 Java 或 Kotlin 语言。 - Graphics:图形缓冲区队列向屏幕显示像素(包括 GL 表面、GL 纹理等等)所使用的内存。(请注意,这是与 CPU 共享的内存,不是 GPU 专用内存。)
- Stack:您的应用中的原生堆栈和 Java 堆栈使用的内存。这通常与您的应用运行多少线程有关。
- Code:您的应用用于处理代码和资源(如 dex 字节码、经过优化或编译的 dex 代码、.so 库和字体)的内存。
- Others:您的应用使用的系统不确定如何分类的内存。
- Allocated:您的应用分配的 Java/Kotlin 对象数。此数字没有计入 C 或 C++ 中分配的对象。
如果连接到搭载 Android 7.1 及更低版本的设备,只有在 Memory Profiler 连接到您运行的应用时,才开始此分配计数。因此,您开始分析之前分配的任何对象都不会被计入。不过,Android 8.0 及更高版本附带一个设备内置分析工具,该工具可跟踪所有分配,因此,在 Android 8.0 及更高版本上,此数字始终表示您的应用中待处理的 Java 对象总数。
参考
[1] Eclipse Memory Analyzer
[2] wiki mat - eclipse
[3] eclipse-memory-analyzer - eclipse
[4] 使用 Memory Profiler 查看 Java 堆和内存分配 - developer
[5] Memory Analyzer - Eclipse documentation
[6] MAT 使用进阶
[7] Android 内存优化(1) - MAT 使用入门